Chart Recorders Vs. Data Loggers
Evaluating the Differences Between Old & New Temperature Recording Devices
In recent years, temperature logging for refrigeration and other applications has seen a shift from standard paper chart recorders to new digitally based data loggers. While there is certainly a learning curve to be made with this new technology, the benefits of switching are well worth the effort. Chart recorders, which have been in use for over a century, come with several limitations in their use, while also requiring more materials and space. With their digital design, data loggers are not only the more environmentally friendly logging solution, but they also provide more flexibility and accuracy in their recording capabilities.
This article seeks to justify the current shift from chart recorders to data loggers and will focus solely on their most popular application as temperature monitoring devices. In order to have an in-depth look, data loggers and chart recorders will be judged in 8 categories: size, ease of use, flexibility, accuracy, archiving & accessibility, maintenance, cost, and environmental friendliness. It should be noted that there are two main types of chart recorders: strip and circular chart recorders. However, only circular chart recorders will be put in the scale with data loggers as most temperature chart recorders are circular chart recorders.
Size
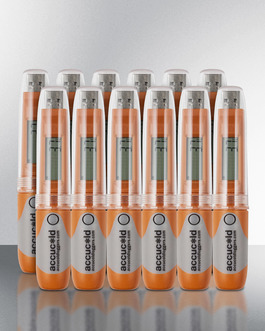
Data loggers and chart recorders are both portable and small enough for users to carry and transport, though chart recorders are generally bulkier than digital data loggers due to the slightly larger size of their components. A traditional chart recorder has a mechanical or electrical motor to rotate the chart in addition to its mechanical sensor element. Also, it has a place for a circular paper chart whose diameter can range from 3 to 8 inches. On the other hand, a data logger includes a microprocessor with a sensor chip or a detachable probe, both of which are very small. With electronic components inside, portable data loggers can be very small; some are just slightly larger than a stylus. This characteristic of data loggers allows measurement to take place at any desired location.
Verdict: Advanced technology helps to make everything as small as possible and gives data loggers the advantage in this category.
Additional Resources:
How To Select a Medical Refrigerator
Safe Vaccine Handling
Protection During Power Outages
Options For Temperature Monitoring
FAQs About Medical Refrigeration
Temperature Conversion Chart
Accucold Resources
Studies & Experiments:
Comparing Medical & Dorm-Style Refrigerators
Chart Recorders Vs. Data Loggers
The Importance of Glycol
The Case For Factory-Installed Probes
Accucold Refrigeration:
Performance Series Packages
Vaccine Series Refrigeration
Medical & Laboratory Refrigerators
Medical & Laboratory Freezers
Low Temperature Freezers
Interior Locking Compartments
Calibrating Your Accucold Equipment
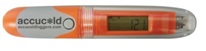
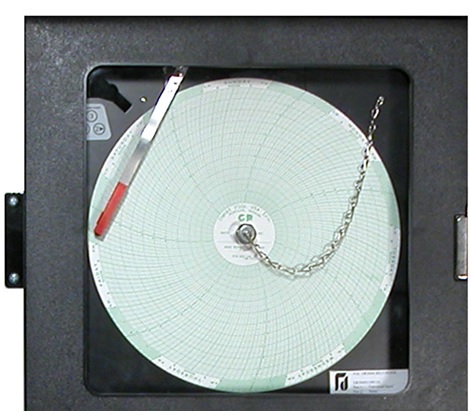
Figure 1. Accucold portable data logger (top) and a chart recorder
Ease of Use
It takes less than 5 minutes with a few simple steps to have a data logger or a chart recorder up and running. Both devices are user-friendly and do not require any specific skills to set up.
With temperatures recorded onto their paper charts, chart recorders provide an instantaneous look at the entire data output without having to perform any additional steps. For data loggers, some basic computer skills are needed to download the data to a computer in order to look at all the temperature measurements. In addition, a few extra steps may be performed to obtain charts or graphs from the data. Fortunately, that may no longer be a concern as new data loggers are aided with software to automatically export data and supply a detailed report with charts and graphs to a computer for fast viewing when connected.
Verdict: Although both devices are relatively simple to set up, data loggers may require a few extra steps to be performed in order to see the data recorded. Although newer models of data loggers make setup easier with fewer steps, the majority of the market has not yet caught up. Because of this, chart recorders are the winners of this category.
Flexibility
Data loggers may require a little more effort to download data or to sketch graphs; at the same time, they give users the power to determine how to present the data. Details such as upper and lower limits can also be added for better illustration. Moreover, with the temperature measurements collected from data loggers, Microsoft Excel and other .CSV applications can help to simulate the circular charts of chart recorders.
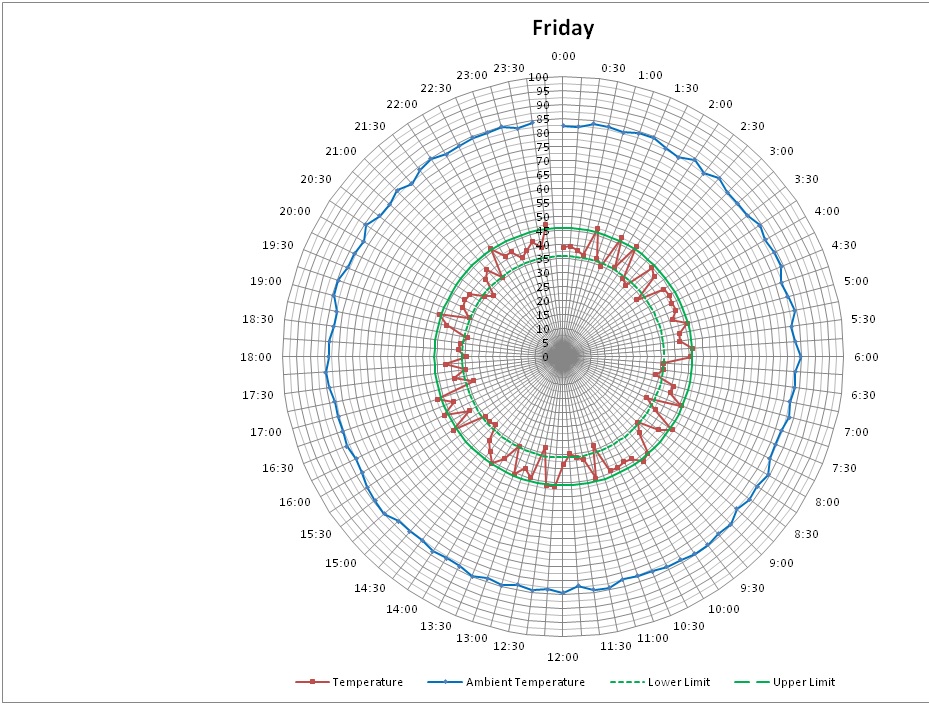
Figure 2. Circular chart made by Excel
Data loggers allow users to configure logging frequency, which can be as small as 15 seconds, whereas chart recorders often do not leave that option available to users. Data loggers can also provide temperature measurements in both Celsius and Fahrenheit scales. As chart recorders rely primarily on their paper charts to capture temperature measurements, they cannot provide temperature in both scales. In addition, data loggers are digital devices that can be programmed with many features, the most useful of which is an alarm. This feature is ideal for facilities with medical refrigerators as it alerts staff in cases where the temperature goes out of a specified safety range, potentially destroying the viability of the vaccine stored inside. The power of PC in data analysis is undeniable. Because data loggers save the exact values of temperature digitally, data can be easily transferred to a computer. With Microsoft Excel as well as other analysis tools, users can calculate maximum, minimum, average temperature, or all other values of interest in just a few seconds. On the other hand, besides color of pen or resolution of chart, chart recorders provide few added benefits to their users.
Verdict: While chart recorders allow very little freedom, data loggers provide users with useful features and let them process the data however they want. Therefore, data loggers are clear winners of this category.
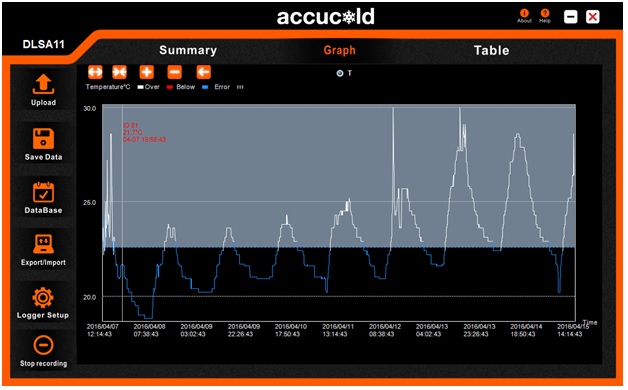
Figure 3. Graph created by aided software
Accuracy
Accuracy is the most important quality of a measurement instrument. To many people, chart recorders have been considered a bit unreliable because of their paper charts’ low resolution (as seen below in Figure 4). Resolution has long been the biggest problem with both chart recorder users and makers, as it is impossible to address this problem properly. Bigger charts provide higher resolution, but at the same time require larger chart recorders; consequently, size and resolution of chart recorders always have to be kept balanced. Data loggers have a much higher resolution as they record temperature digitally and provide results as accurate as 0.1℉. Although some chart recorders are now integrated with an LCD screen to display exact values of temperature, they do not save these numbers onto their paper charts.
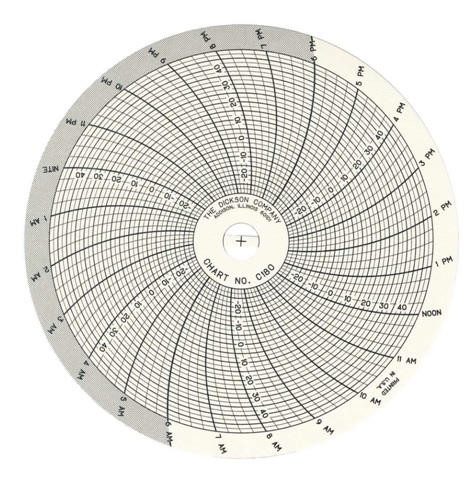
Figure 4. Circular chart of a chart recorder
Another problem with mechanical chart recorders is that they react slowly to temperature change, meaning they cannot always detect sudden temperature fluctuations. Electronic devices (such as data loggers) have a much better response time in this area.
Verdict: Chart recorders are in no way at the same accuracy level as data loggers. In places such as vaccine facilities where 1 or 2 degrees can make a huge difference in determining whether to keep or dispose of vaccines, data loggers are certainly far better choices. With their superior accuracy, data loggers win this category easily.
Archiving & Accessibility
As mentioned, while chart recorders store measurements on paper charts, data loggers save data in digital files. Having digital files is tremendously beneficial and extremely helpful in storing and organizing data.
Many vaccine facilities require temperature data to be kept for at least 3 years in order to serve the purpose of analyzing long-term trends. Recording temperature every day for a year with a chart recorder will produce 365 paper charts. With more than a thousand paper charts after 3 years, finding a specific date from an unorganized stack of paper charts is like finding a needle in a haystack and obviously not something anyone wants to do.
Once set up, data loggers record the date and time of each temperature measurement. Users can either organize the data by themselves or with the help of software that automatically archives all data for them. By saving data on computers, looking for past data is no longer a time-consuming task. Moreover, data from data loggers does not need any physical space to store, as opposed to the piles of paper charts accumulated from recording with chart recorders.
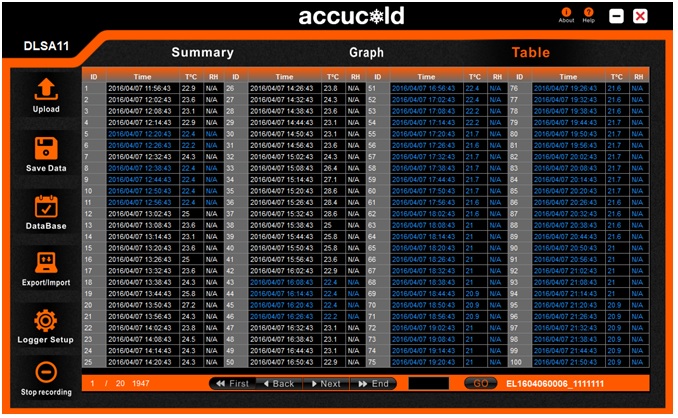
Figure 5. Data is stored and organized with data logger's accompanying software
In addition, data collected using data loggers can be easily shared with other people through email with just a few clicks. It can be argued that a paper chart could be scanned and uploaded to a computer, but doing so not only requires an additional scan machine but also more time for a process that can easily be done with data loggers.
Verdict: Storing and sharing data has never been easier than with data loggers. Why spend time hunting copies of charts when you can find them with a search button on a computer? In this category, data loggers clearly have the upper hand over chart recorders.
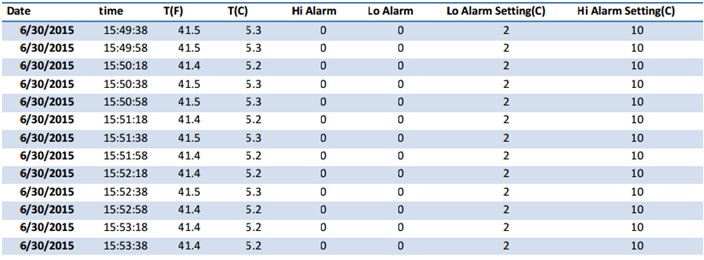
Figure 6. Data exported from Accucold DL2 data logger
Maintenance
Chart recorders require a great deal of care from users as they are made of mechanical components. Sensors of chart recorders tend to drift off over time, requiring regular checks and re-calibration. Since the majority of chart recorders uses batteries, their power sources also need to be checked and replaced often in order to keep the temperature recording process running smoothly and without any disruption. Pens and charts need to be changed frequently; lateness in replacing charts and pens will result in invalidated measurements and data losses. Data loggers, with fewer components, do not require as much care and frequent maintenance as chart recorders.
Verdict: Chart recorders are obviously very high-maintenance and unless you are willing to give them the attention they need, data loggers are a far better choice.
Cost
A basic data logger or chart recorder usually costs between $200 and $300. Depending on the specifications and features of the device, price may vary up to $1000. In addition to the flat cost of the device, the operational cost of chart recorders is much higher than that of data loggers. Below is the total estimated cost, including device & operation costs for a basic Accucold data logger and a standard chart recorder in one year:
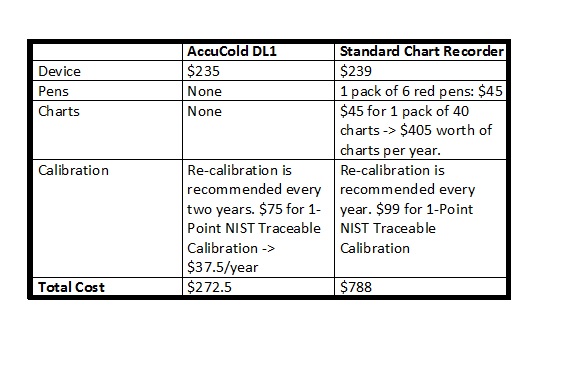
Putting the device costs aside, the chart recorder, with its very high-maintenance characteristic, entails an enormous cost of operation. Verdict: Even though data loggers and chart recorders are sold at a similar starting price, the additional cost to run a chart recorder is much higher than that of a data logger.
Environmental Friendliness
Simply put, chart recorders require paper. Data loggers do not.
As more and more companies are implementing paperless office policies, all industries, from banking to, well, temperature logging, are finding ways to eliminate the need for paper. Aside from the cost savings mentioned earlier regarding a constant paper supply, the paperless operation of data loggers ensures a much more environmentally friendly option.
Verdict: The excessive amount of papers used by chart recorders make them less attractive to any user who actively cares about environmental concerns. With that victory, data loggers have just beaten chart recorders to win our last category.
Conclusion:
By winning 7 out of our 8 categories, data loggers show why they have taken over the popularity of chart recorders. With a smaller size, superior accuracy, and incredible ability to edit, store, and share data, data loggers are much better temperature recording devices than chart recorders. Data loggers are also very low maintenance and have a very low operation cost compared to chart recorders which not only saves users time but also a lot of money. It is no wonder that the Centers for Disease Control and Prevention (CDC) recommends the use of a digital data logger for vaccine monitoring and puts chart recorders in the list of devices that should not be used to monitor temperature of medical products.
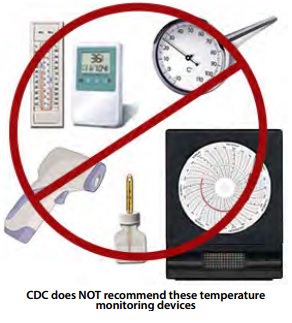
Figure 7. Chart recorders are not recommended by the CDC
Lastly, digital data loggers offer the added benefit of peace of mind. As we become more and more aware of the importance of reducing our carbon footprints, our reliance on paper will continue to dwindle. With their paper requirements, chart recorders are hardly the green option for temperature logging. In addition to offering more accurate temperature readings, more customized data readouts, and financial savings, digital data loggers are the environmentally friendly option for maintaining optimum temperature records in the most responsible way.
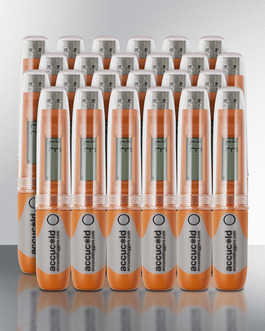
USB Data Loggers By Accucold
DLSA11CAL-24P

DLSA11CAL-12P

DLSA11-24P