The Importance of Using Glycol-Encased Temperature Probes
By this point in your research on medical and scientific refrigeration, you have probably heard quite a bit about using glycol-encased probes for temperature monitoring. From the CDC’s recommendations on vaccine storage to Accucold’s own sales staff, most experts in the field of laboratory refrigeration strongly encourage using temperature probes with a thermal buffer (the most common substance being glycol). In order to demonstrate the importance of this type of probe setup, our Accucold laboratory staff conducted an experiment that compared the differences recorded in measuring temperature between a glycol-encased probe and standard probe exposed to air. This article includes a non-technical report from the experiment and provides some scientific explanations regarding the use of a glycol-encased probe over a normal probe for medical refrigerator monitoring.
Why is Temperature Monitoring Important?
An accurate temperature reading that reflects actual vaccine temperatures is critical in protecting vaccines. According to the CDC, refrigerated vaccines should be stored at temperatures between 2℃ and 8℃ (36℉ and 46℉), while vaccines stored in the freezer should maintain temperatures between -50℃ and -15℃ (-58℉ and 5℉). Allowing the temperature to go outside these ranges compromises the efficacy of stored vaccines. Administering damaged vaccines can present dangerous health risks to patients.
In addition to maintaining the integrity of a vaccine, investing in reliable temperature monitoring devices will ultimately save your facility thousands of dollars . Temperature readings directly affect the decision whether to keep or throw away the contents of your refrigerator. Using malfunctioning or non-reliable monitoring products could lead to replacing viable vaccines due to inaccurate temperature readings that lead you to believe they are damaged.
Is Using a Probe Exposed to Air a Good Idea?
"Normal probes" mentioned in this article refer to all the temperature sensors that are not encased in glycol or other thermal buffers. Although these probes are perfect for measuring ambient temperature, they are less reliable when it comes to reflecting the actual temperature of medical products inside refrigerators. Due to their sensitivity in capturing air temperature, a slight change in air flow could result in a different temperature reading.
Air temperature could change quickly due to the rapid movement of molecules within air, but that does not mean the temperature of vaccines or any other contents in refrigerators would behave in the same way. Heat transfer laws indicate that an object will not instantly trade its temperature for the temperature of its surroundings. How fast the object obtains thermal equilibrium with the surroundings depends on many factors. Vaccines and other medical materials kept inside refrigerators have the ability to store heat energy and maintain low temperature. This ability prevents warm air from raising the temperature in a short amount of time.
When the refrigerator’s door is open or when the refrigerator is performing its defrosting cycle, hot air currents rush in and immediately alter the reading of the normal probe. During defrost cycles, the evaporator coil behind the refrigerator is heated up to a high enough temperature to melt any ice or frost that may form inside, but at the same time, not too high to diminish or ruin the potency of the vaccines. Due to the large amount of heat supplied during this process, air temperature is drastically higher than the actual temperature of vaccines. Sometimes, this perceived difference in temperature readings results in disposal of perfectly viable vaccines.
How Does a Thermal Buffer such as Glycol Provide More Accurate Readings?
According to the CDC guidelines for vaccine storage, a detachable probe in a bottle filled with a thermal buffer, such as glycol, more closely reflects vaccine temperatures. As indicated before, vaccine temperatures have been found to be more thermo-stable than air temperature which fluctuates with door openings/closings and defrost cycles. Suspending a probe in a sealed glycol bottle helps to prevent intermittent air currents from throwing the readings off and averages out the temperatures of the surroundings, consequently reflecting the actual temperature of vaccines inside refrigerators.
Glycol is often preferred over other thermal buffers because it has a low freezing temperature which allows more accurate temperature measurement in medical freezers.
Additional Resources:
How To Select a Medical Refrigerator
Safe Vaccine Handling
Protection During Power Outages
Options For Temperature Monitoring
FAQs About Medical Refrigeration
Temperature Conversion Chart
Accucold Resources
Studies & Experiments:
Comparing Medical & Dorm-Style Refrigerators
Chart Recorders Vs. Data Loggers
The Importance of Glycol
The Case For Factory-Installed Probes
Accucold Refrigeration:
Performance Series Packages
Vaccine Series Refrigeration
Medical & Laboratory Refrigerators
Medical & Laboratory Freezers
Low Temperature Freezers
Interior Locking Compartments
Calibrating Your Accucold Equipment
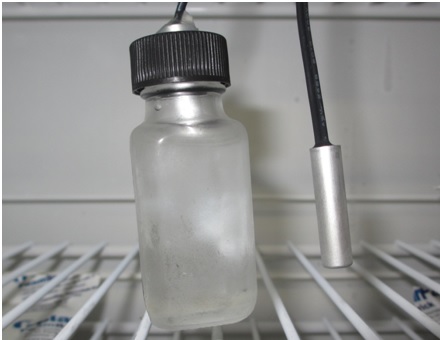
Figure 1: Glycol-encased probe and normal probe
Experiment Setup:
This experiment was divided into two parts. Part 1 included four medical refrigerators. To simulate frequent door opening of refrigerators at medical facilities, each refrigerator’s door was fully opened for 10 seconds at 15 minute intervals for the first four consecutive hours in each run. In addition, this part was carried out in a total of 12 runs with various amounts of loadings. Two gel packs were used as loads in the first four runs (counted as 5% loading), eight more gel packs were then added in the next four runs (increased to 25% loading), and finally 20 more gel packs were added in the last four runs (75% loading) (figure 3). The test was repeated four times for each loading to achieve consistency.
Four Accucold FF7L units were used; each one was modified so that they were slightly different from each other:
1A: Dial thermostat with cross-flow fan
1B: Dial thermostat without fan
1C: Digital thermostat with cross-flow fan
1D: Digital thermostat without fan
Part 2 included an Accucold ACF48W, a frost-free vaccine storage freezer. The unit was loaded with 15 water bottles which were evenly distributed throughout the freezer. No door opening was involved in this part. Six runs were carried out in total this time. The duration of each run was increased from 18 hours up to 160 hours in order to have a thorough look at the temperature change during defrosting cycles.
For all units in both parts, two probes were set up for each unit: one was placed in a vial full of glycol with a small hole drilled at the top and one was not (figure 1). They were placed next to each other at the center for most accurate temperature readings. These probes were connected to two digital data loggers which were programmed to record one reading every 15 minutes (figure 2). The connected wires used were thin enough so that their impact on the interior temperature was negligible.
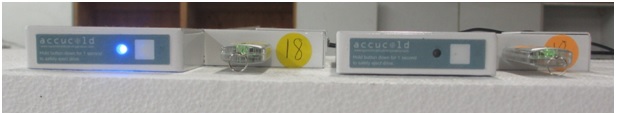
Figure 2: Probes were connected to two digital data loggers placed on top of the refrigerator
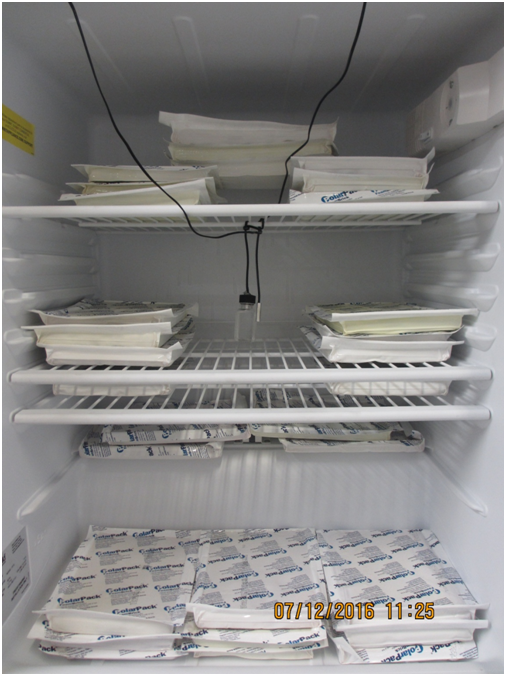
Figure 3: An Accucold FF7L with 75% loading
Experiment Results:
The data collected was summarized in the charts below together with their graphs. Average, maximum, and minimum temperatures were calculated together with the standard deviation for each set of temperatures.
Standard deviation is the quantity used to measure the amount of variation of a set of data points. In this experiment, a low standard deviation indicates that the temperature measurements are close to the average temperature, while a high standard deviation indicates that the temperature measurements are spread out and fluctuate over a wider range of values.
I. Part 1:
For the sake of simplicity, only one run for each loading is shown below.
a. 10% loading:
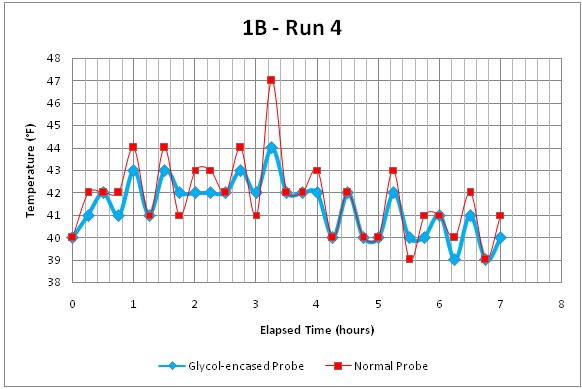
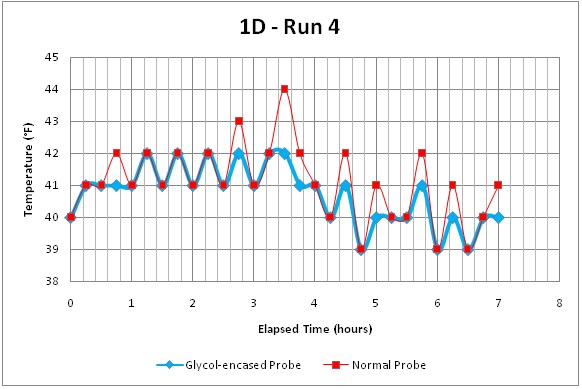
Run 4: Glycol-Encased Probe Results
| Run 4 | Average (ºF) | Min (ºF) | Max (ºF) | Standard Deviation (ºF) |
|---|---|---|---|---|
| 1A | 42.78ºF | 41ºF | 46ºF | 1.19ºF |
| 1B | 42.38ºF | 39ºF | 44ºF | 1.21ºF |
| 1C | 36.15ºF | 34ºF | 39ºF | 1.72ºF |
| 1D | 40.08ºF | 39ºF | 42ºF | .92ºF |
Run 4: Normal (Air) Probe Results
| Run 4 | Average (ºF) | Min (ºF) | Max (ºF) | Standard Deviation (ºF) |
|---|---|---|---|---|
| 1A | 42.71ºF | 40ºF | 46ºF | 1.45ºF |
| 1B | 40.93ºF | 39ºF | 47ºF | 1.53ºF |
| 1C | 36.93ºF | 32ºF | 41ºF | 2.79ºF |
| 1D | 40.30ºF | 39ºF | 44ºF | 1.11ºF |
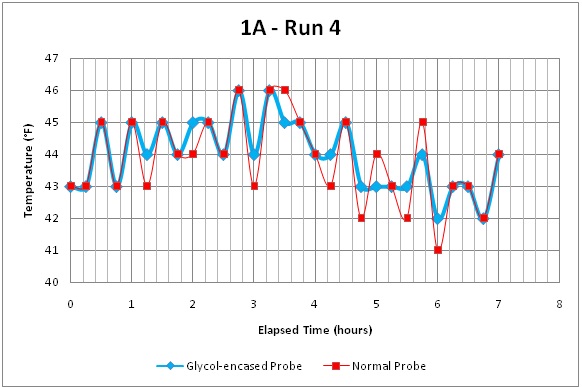
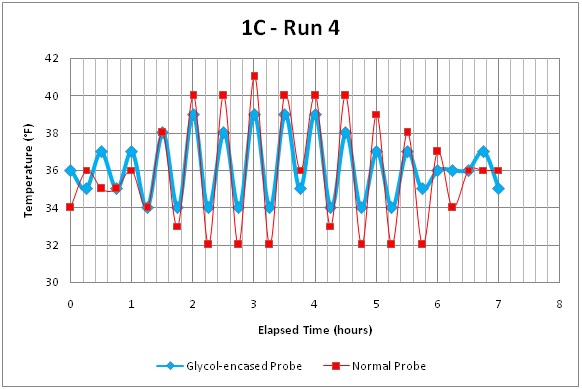
Looking at the chart above, it is noticeable that though the average temperatures calculated appear to be very similar between two probes for every unit, the standard deviation of the glycol-encased probe is smaller than that of normal probe. This difference is largest on unit 1C as the standard deviation of the glycol-encased probe and normal probe are 1.72 and 2.79, respectively.
Using the graphs, it does not take a scientist to see the clear difference between a glycol-encased probe and normal probe. Take unit 1B for example: the temperatures recorded by the normal probe shows higher fluctuation than those recorded by a glycol-encased probe. The biggest difference between two consecutive temperature measurements of a glycol-encased probe is only 2℉ (from 42℉ to 44℉) while that of normal probe is 6℉ (from 41℉ to 47℉).
b. 25% loading:
Run 8: Glycol-Encased Probe Results
| Run 8 | Average (ºF) | Min (ºF) | Max (ºF) | Standard Deviation (ºF) |
|---|---|---|---|---|
| 1A | 43.93ºF | 43ºF | 47ºF | .97ºF |
| 1B | 41.62ºF | 40ºF | 45ºF | 1.12ºF |
| 1C | 36.18ºF | 34ºF | 39ºF | 1.06ºF |
| 1D | 41.40ºF | 40ºF | 45ºF | 1.03ºF |
Run 8: Normal (Air) Probe Results
| Run 8 | Average (ºF) | Min (ºF) | Max (ºF) | Standard Deviation (ºF) |
|---|---|---|---|---|
| 1A | 43.95ºF | 42ºF | 49ºF | 1.34ºF |
| 1B | 42.15ºF | 40ºF | 48ºF | 2.18ºF |
| 1C | 35.85ºF | 32ºF | 41ºF | 2.18ºF |
| 1D | 41.76ºF | 40ºF | 46ºF | 1.16ºF |
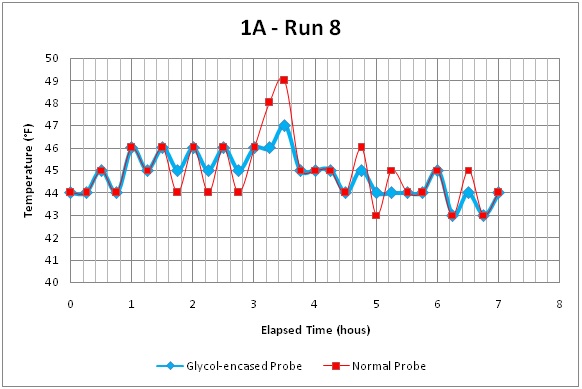
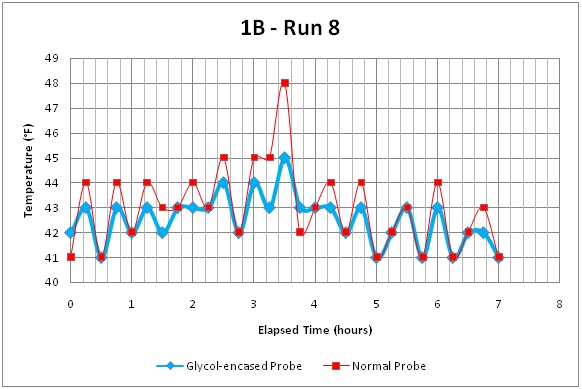
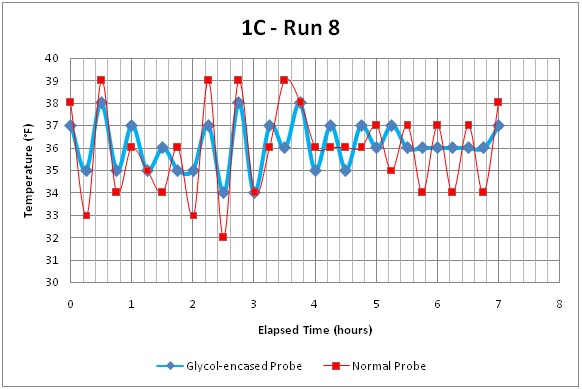
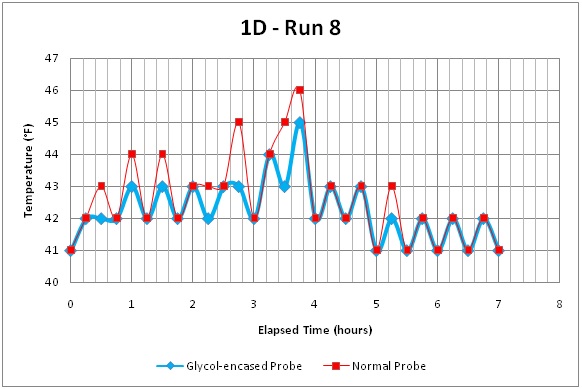
With 25% loading, the change in temperature recorded by the normal probe seems to be more dramatic. As previously mentioned, the recommended temperature range for refrigerated vaccines is between 36℉ and 46℉. Looking at the chart, we can see that the upper limit of this range is breached by unit 1B as its maximum temperature recorded by the normal probe is 48℉. This can be confirmed by looking at graph 1B-Run 8. The temperature suddenly spiked to 48℉ from 45℉. This temperature reading indicates that vaccines might have gone bad had there been any inside. However, this is only true if we are using the data from the normal probe. Looking at the data recorded by a glycol-encased probe of the same unit, the maximum temperature of unit 1B is only 45℉, indicating that the temperature range was preserved.
c. 75% loading:
#emily { margin-top: 5px; } #emily th { padding: 10px 20px 10px 20px; background: cyan; } #emily td { padding: 10px 20px 10px 20px; font-size: 20px; }Run 12: Glycol-Encased Probe Results
| Run 12 | Average (ºF) | Min (ºF) | Max (ºF) | Standard Deviation (ºF) |
|---|---|---|---|---|
| 1A | 43.18ºF | 42ºF | 46ºF | .76ºF |
| 1B | 40.95ºF | 40ºF | 44ºF | .87ºF |
| 1C | 34.50ºF | 31ºF | 37ºF | 1.30ºF |
| 1D | 42.02ºF | 41ºF | 45ºF | .76ºF |
Run 12: Normal (Air) Probe Results
| Run 12 | Average (ºF) | Min (ºF) | Max (ºF) | Standard Deviation (ºF) |
|---|---|---|---|---|
| 1A | 43.18ºF | 42ºF | 48ºF | .94ºF |
| 1B | 41.54ºF | 40ºF | 48ºF | 1.12ºF |
| 1C | 34.25ºF | 30ºF | 40ºF | 1.63ºF |
| 1D | 42.09ºF | 41ºF | 49ºF | .9ºF |
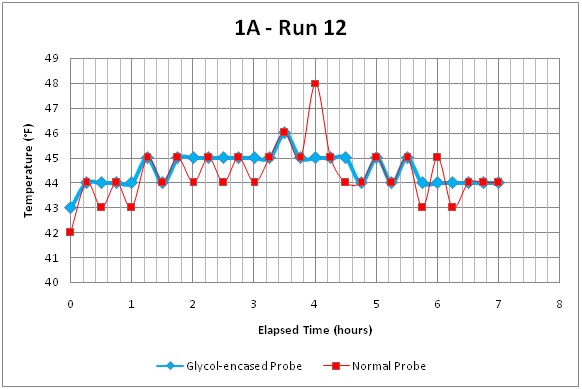
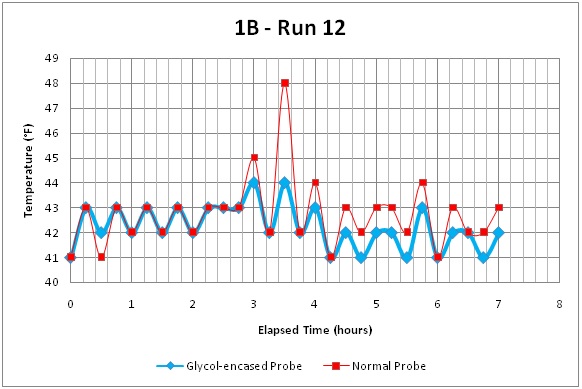
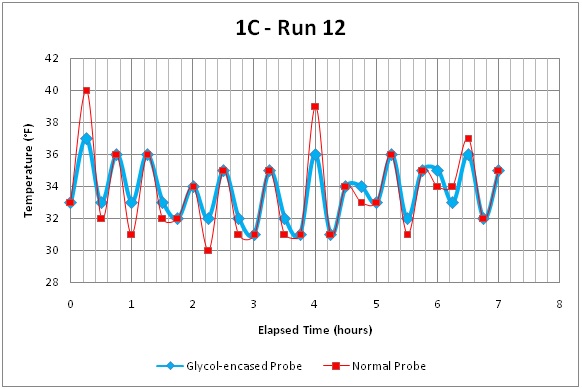
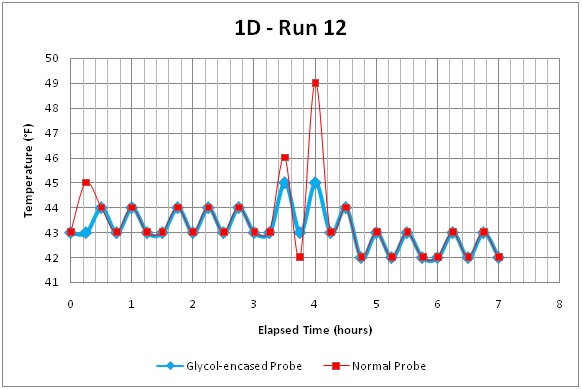
75% loading means the inside of the refrigerators is almost filled up. Three out of four refrigerators had their temperature go out of the safety range for vaccines according to the data collected with a normal probe. Similar to previous loading, temperature measurements from glycol-encased probes show slighter change in temperature and peaks at lower temperatures that are within the range.
II. Part 2:
a. 20 hours:
Run 2: Glycol-Encased Probe Results
| Run 2 | Average (ºF) | Min (ºF) | Max (ºF) | Standard Deviation (ºF) |
|---|---|---|---|---|
| 1A | -5.67ºF | -7ºF | 1ºF | 1.737ºF |
Run 2: Normal (Air) Probe Results
| Run 2 | Average (ºF) | Min (ºF) | Max (ºF) | Standard Deviation (ºF) |
|---|---|---|---|---|
| 1A | -5.38ºF | -9ºF | 12ºF | 3.546ºF |
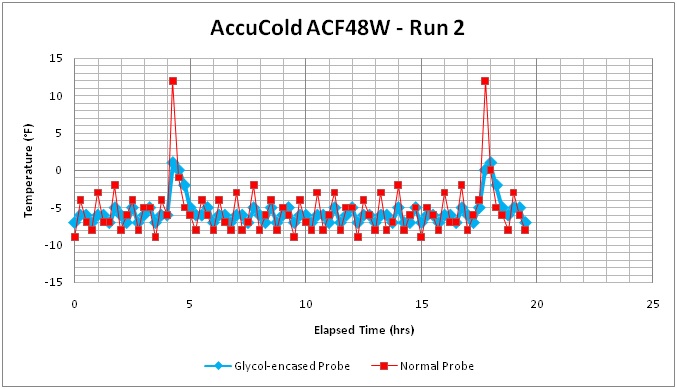
Throughout 20 hours, the freezer went through defrost cycles twice; these cycles could be seen in the graph above by the dramatic changes in temperature. At the first defrost cycle, the temperature suddenly jumped to 12℉ from -4℉ in just 15 minutes. This phenomenon is repeated at the second cycle. As previously stated, the temperature range for vaccines stored in a freezer is between -58℉ and 5℉. If there had been vaccines in the freezer, they would have been disposed of based on the temperature readings from normal probe. At the same time, the temperature measurements of glycol-encased probe rises to 1℉ from -4℉ in both cycles.
b. 70 hours:
Run 2: Glycol-Encased Probe Results
| Run 2 | Average (ºF) | Min (ºF) | Max (ºF) | Standard Deviation (ºF) |
|---|---|---|---|---|
| 1A | -5.9ºF | -8ºF | 1ºF | 1.477ºF |
Run 4: Normal (Air) Probe Results
| Run 2 | Average (ºF) | Min (ºF) | Max (ºF) | Standard Deviation (ºF) |
|---|---|---|---|---|
| 1A | -5.58ºF | -9ºF | 13ºF | 3.006ºF |
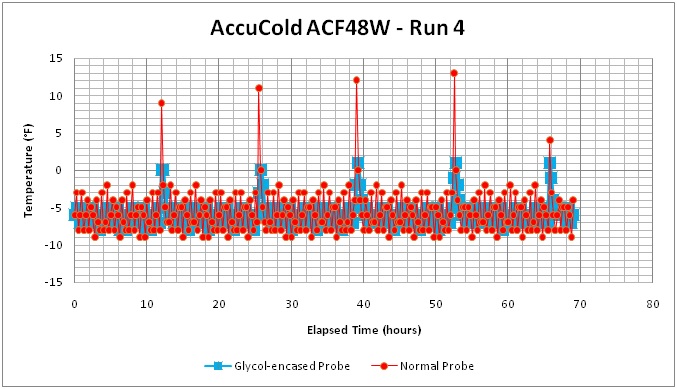
Again, the temperature measurements of normal probes indicate that many times during defrost cycles, the vaccines were put at risk as the temperatures exceeded 5℉. However, the temperatures of glycol-encased probes disputes this as they show that the freezer had never gone out of the safety range. The maximum of the glycol-encased probe is only 1℉ while that of normal probe is 13℉. The standard deviation of the glycol-encased probe is also half that of normal probe (1.477 and 3.006), indicating a huge difference in variation of temperatures collected by two probes.
c. 160 hours:
Run 8: Glycol-Encased Probe Results
| Run 8 | Average (ºF) | Min (ºF) | Max (ºF) | Standard Deviation (ºF) |
|---|---|---|---|---|
| 1A | -5.79ºF | -7ºF | 3ºF | 1.622ºF |
Run 8: Normal (Air) Probe Results
| Run 8 | Average (ºF) | Min (ºF) | Max (ºF) | Standard Deviation (ºF) |
|---|---|---|---|---|
| 1A | -5.57ºF | -9ºF | 15ºF | 2.753ºF |
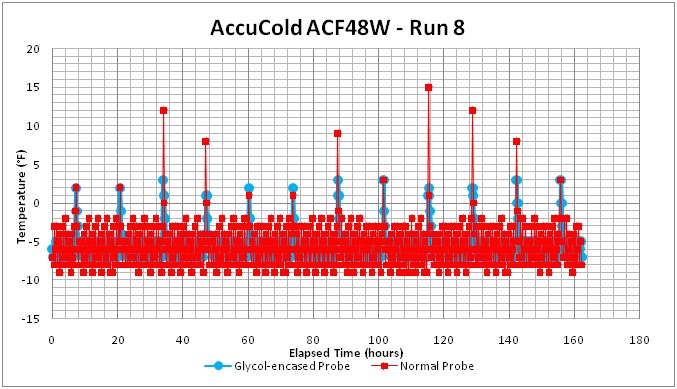
This last run was the most extensive run in this experiment with more than 160 hours. It is easy to see from the graph that the temperatures of the normal probe are spread out over a wider range than the temperatures of glycol-encased probes as the red dots can be seen everywhere from -9℉ to 15℉. Although the temperature of the normal probe matches the temperature of the glycol-encased probe a few times during the defrost cycle, it changes drastically and shows instability throughout the entire run.
Conclusion
As can be seen from the experiment, a normal probe, due to its vulnerability to intermittent air currents, shows high temperature fluctuations, especially when there are door openings or during defrosts cycles. With the standard deviation and the graphs in the experiment, we can see without a doubt that temperature measurements recorded by a normal probe are very unstable. On the other hand, a glycol-encased probe consistently shows stable temperature measurements and undoubtedly is better at representing the temperature of vaccines inside refrigerators. With the experiment being tested with different types of refrigerators, this experiment not only meticulously demonstrated the very difference between glycol-encased probes and normal probes, but also corroborated the CDC’s recommendation. Using a normal probe can result in many problems, of which the most obvious is wasting viable vaccines due to inaccurate readings. Therefore, choosing a glycol-encased probe over a normal probe would not only provide more accurate temperature readings and help to protect your medical materials, but also save you a lot of money in the long term.
References
Centers for Disease Control and Prevention. "Vaccine Storage & Handling Toolkit." June 2016. 15 July 2016